Unlocking the Power of MemProcFS: A Memory Forensics Case Study


This blog has been sitting in my drafts for over two years now, and I've finally decided to publish it. Apologies in advance for the quality of some images, they were captured a long time ago when I first worked on this. Despite that, the content and methodology still hold up, so I hope you find it useful
MemProcFS
MemProcFS is an open-source forensic tool for analyzing memory images. It lets users mount a memory image like a disk, providing file-based access to its contents. This allows investigators to examine process memory and explore memory segments within the image.
Acquiring memory
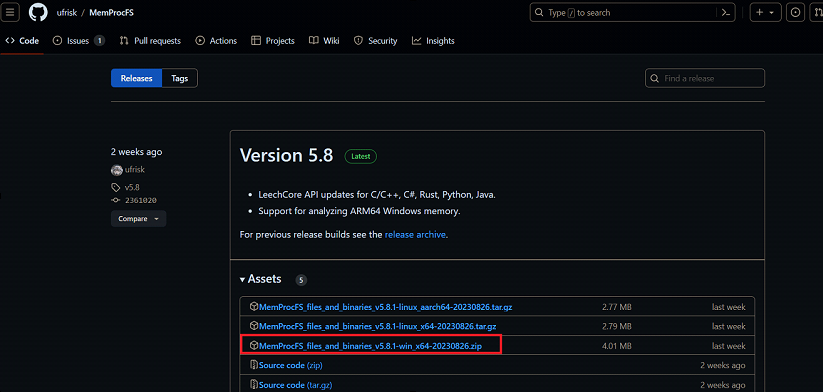
First, we go MemProcFS from the original GitHub repository (https://github.com/ufrisk/MemProcFS), and then we navigate to the Releases section to download the compiled Windows version.
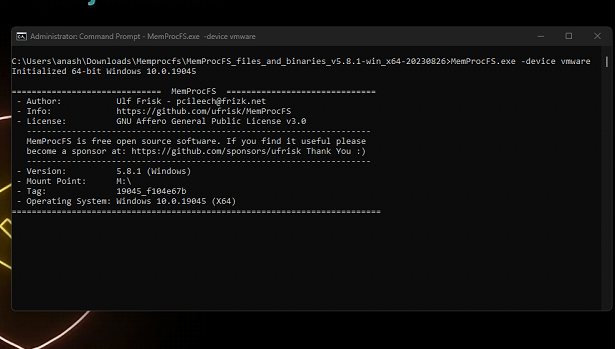
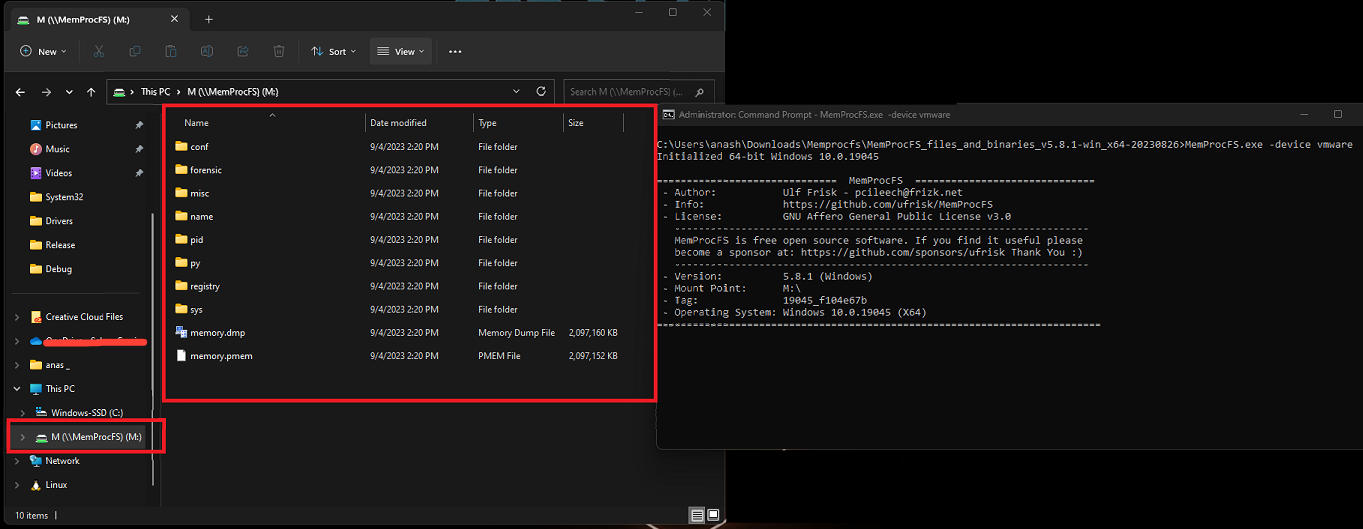
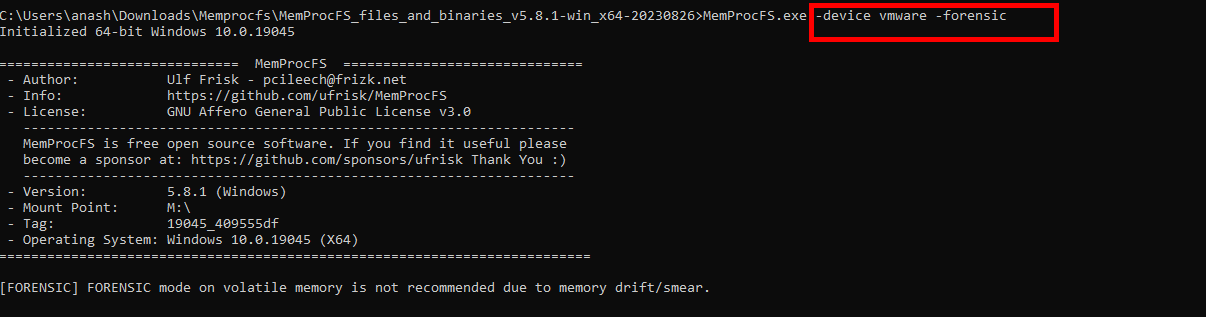
After downloading and extracting the folder, we spawn a privileged command prompt and run the following command MemProcFS.exe -device vmware to acquire VMware memory.
If you get the following error The required DOKANY file system library is not installed.

visit the Dokany repository on GitHub, then download DokanSetup and install it.
https://github.com/dokan-dev/dokany/releases/tag/v2.0.6.1000If you are running multiple VMs, you will get a list from which you can choose to connect. Since we are using only one VM, it will connect directly to it.
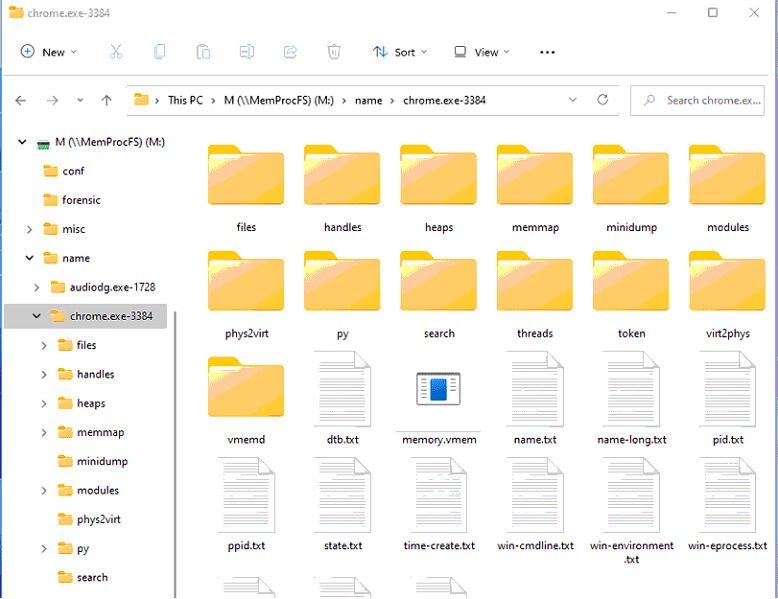
Then the target memory will be mounted, and from there, you can investigate the memory image by exploring drive M, which is the default drive letter.
If you want to mount the memory image with a different drive letter, you can add the -mount argument followed by the drive letter of your choice. For example, -mount D will mount the image on drive D.
Unlocking the Power of MemProcFS
Process tree can be found in the following path:
⦁ M:\sys\proc
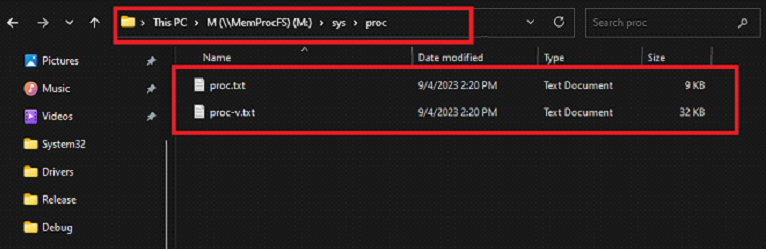
The files in the sys/proc :
⦁ proc.txt list processes and their parent processes in a tree view.
⦁ proc-v.txt also lists process image path and command line.
If you open the proc.txt file, you will find information about all running processes on the system. You can check parent-child relationships by counting the '-' characters.
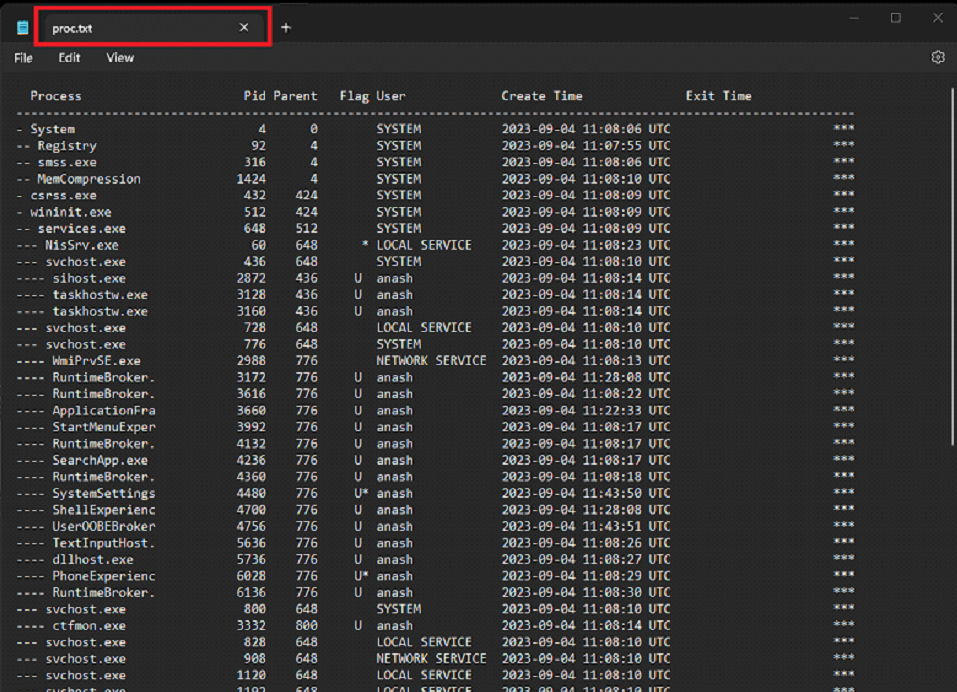
Flags in it:
⦁ 32 : 32-bit process running on 64-bit Windows (WoW64).
⦁ E : Not in the EPROCESS linked list, possible rootkit or memory corruption.
⦁ T : Process has terminated but its memory structures still exist.
⦁ U : Running under a user account, not a system privilege.
⦁ * : Binary is located outside standard paths (e.g., not in System32 or Program Files). Suspicious if seen on system processes.
a quick tip is that you can start by reviewing processes spawned by explorer.exe, since it launches most applications started via the desktop, Start menu, or taskbar.
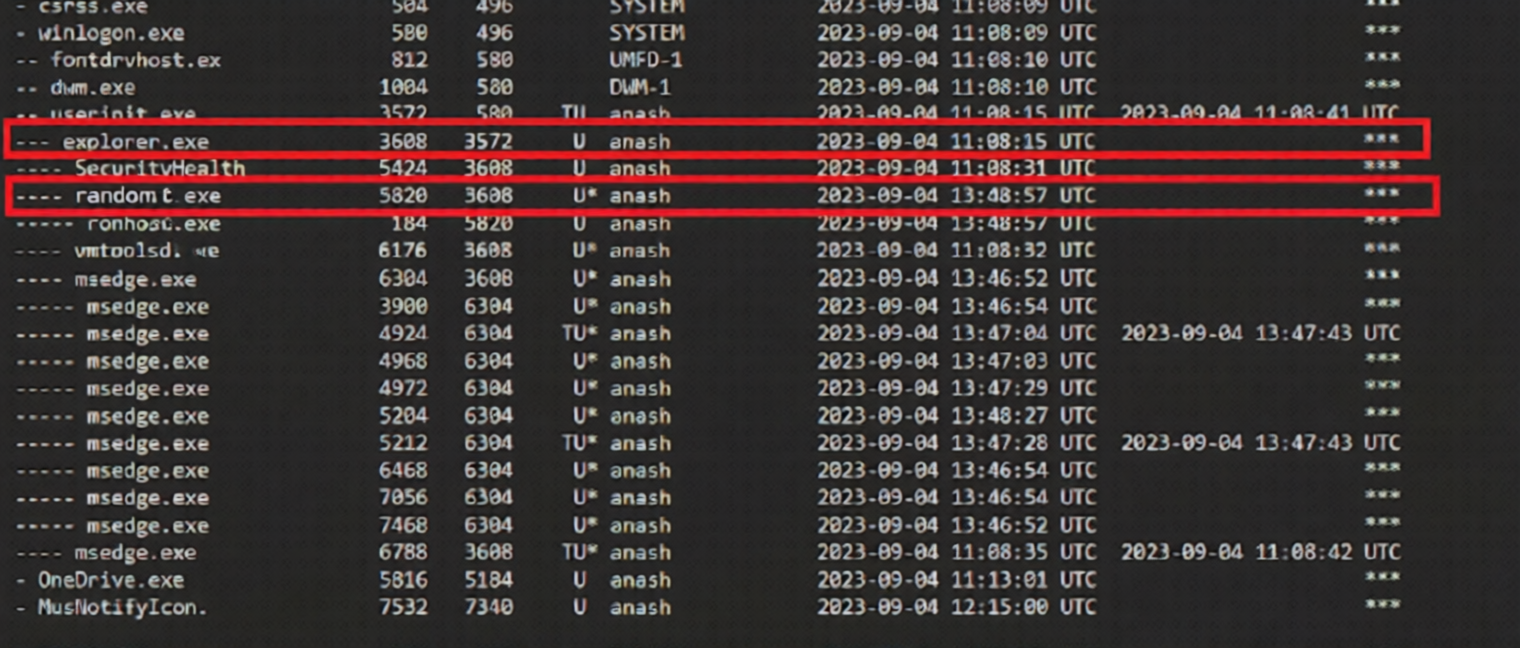
Digging further using proc-v.txt confirms that this is potential malware.

- Privileges: Running with the current user’s privileges.
- High Priority: The process runs at high priority, allowing significant CPU usage.
- Location: The executable is in a user's Downloads folder. Legitimate system processes are usually located in system directories. Placing an executable in a user's Downloads folder is not a common practice for system processes.
Note:
- A process that starts with a single
-is an orphan process, An orphan process is a child process that has been disconnected from its parent process, such as system, csrss.exe, wininit.exe ,winlogon. - A non-natural orphan process may indicate process injection, as the target process is spawned, injected, and then the parent exits.
Services
Windows services are background programs that handle core system tasks like networking, security, and hardware management; however, malware can abuse them for malicious purposes, like.
- Service Hijacking: Malware can replace or modify services to run malicious binaries.
- Privilege Escalation: Exploits services to gain higher system privileges.
- Persistence: Registers as a service to run at every startup.
- Communication Channels: Uses services to connect to C2 servers and exfiltrate data.
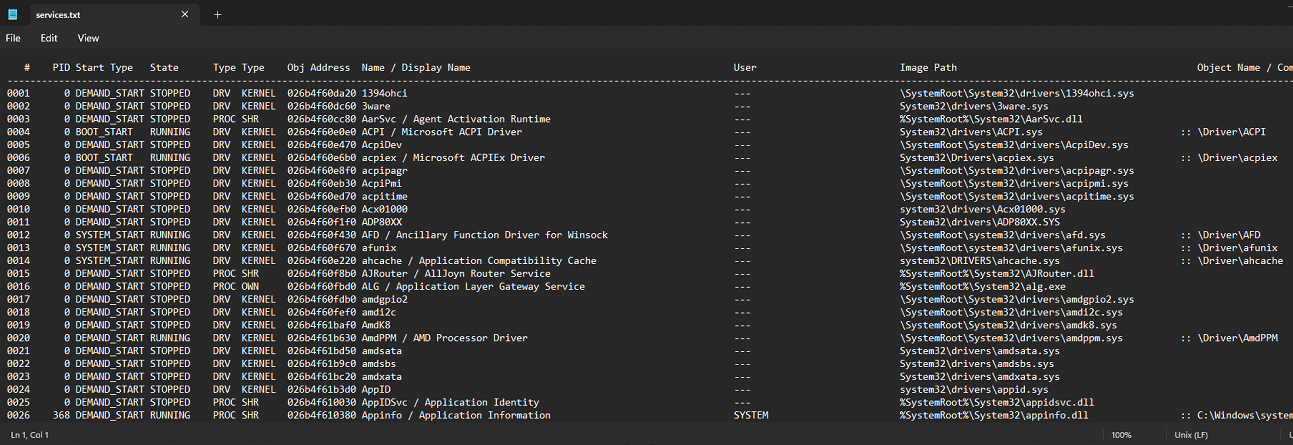
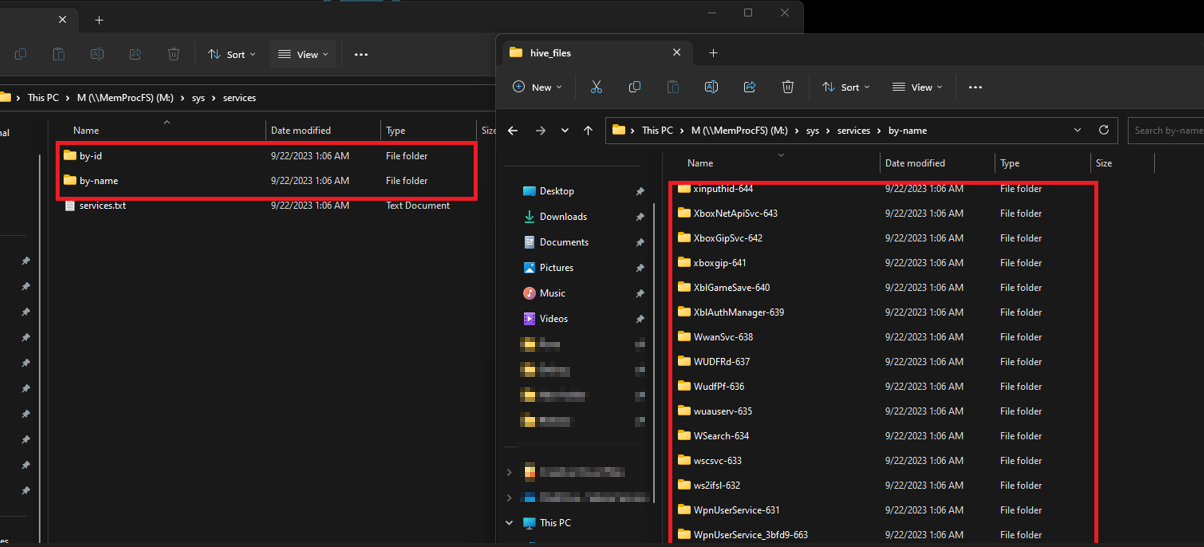
Navigate to the path M:\sys\services and review the list of services running on the system. Pay close attention to abnormal services; you may spot C2 services or the potential use of vulnerable drivers or rootkits.
You can check for additional information in the by-name or by-id folder, which contains all the details about each service.
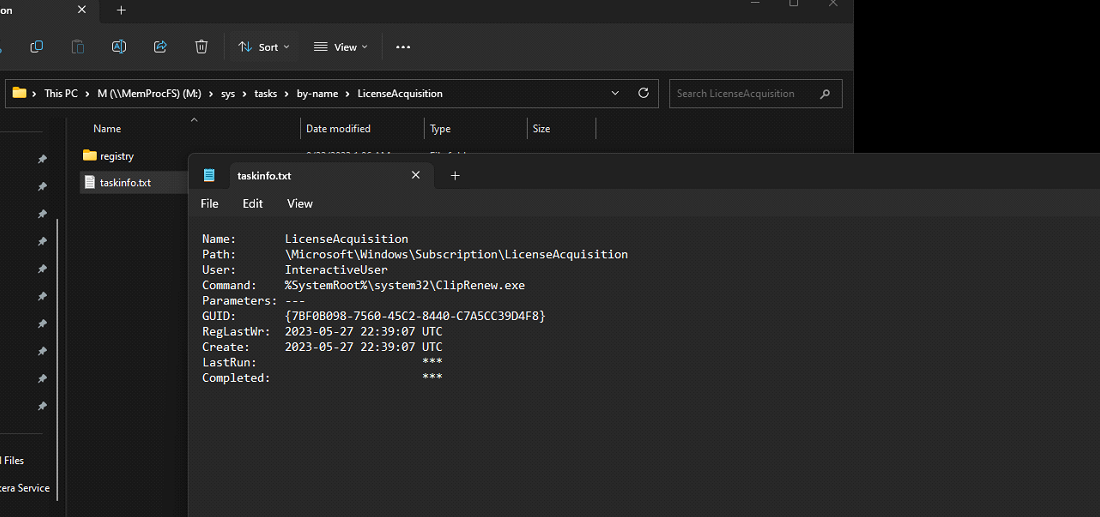
The directory at M:\sys\tasks\by-name contains information about scheduled tasks extracted from the registry.
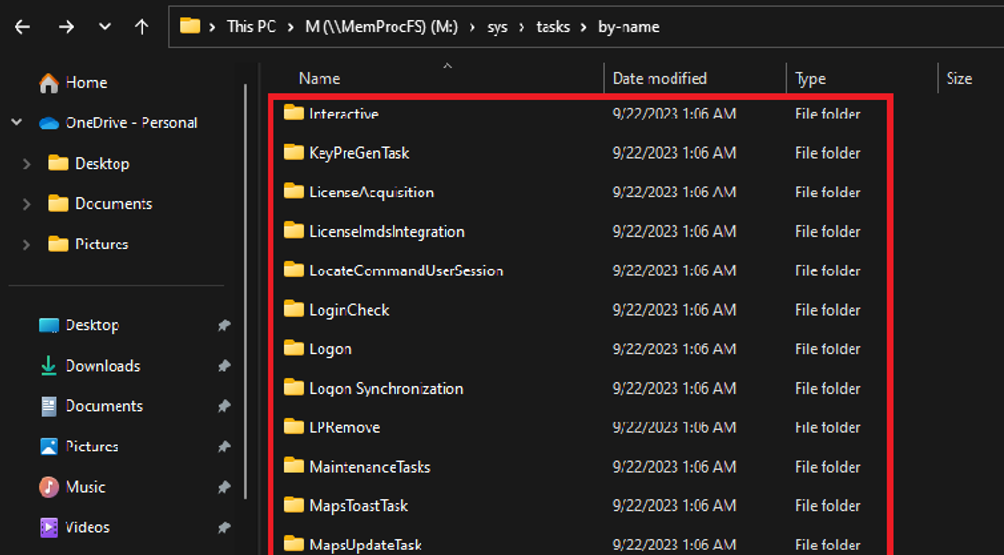
Having this directory can be extremely helpful in identifying any abnormal tasks used for persistence.
Network and Protocols
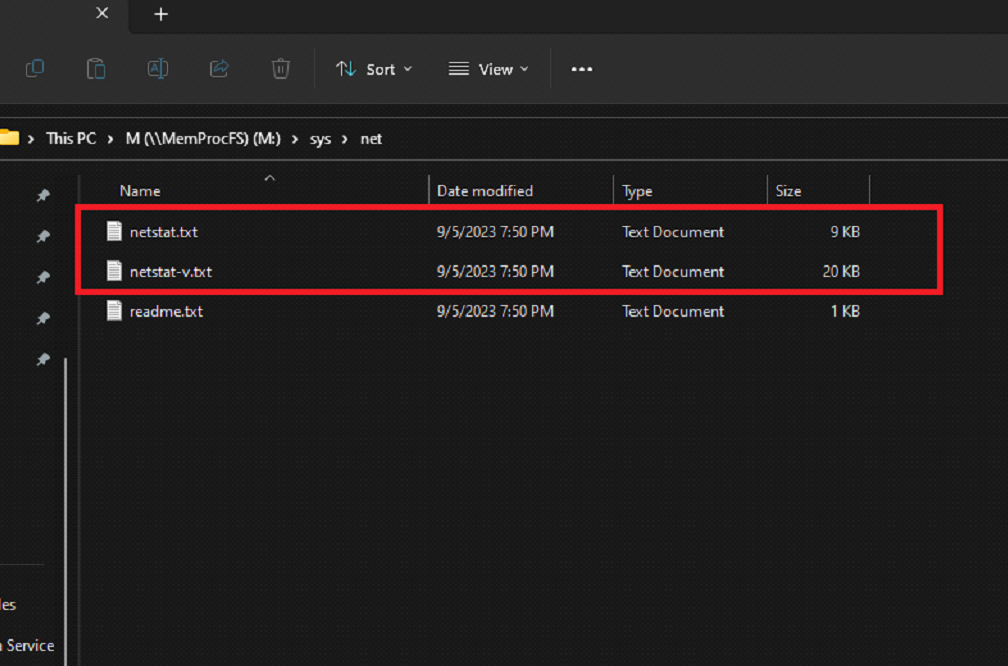
To get the list of network status, go to M:\sys\net, where you will find two files: netstat.txt and netstat-v.exe. It's better to start with netstat-v.exe as it is an extended version and contains more information, which will save you time compared to reading netstat.txt and then switching to the verbose version.
The output contains information like the netstat command. Note that this may not show all network connections due to timing acquisition.
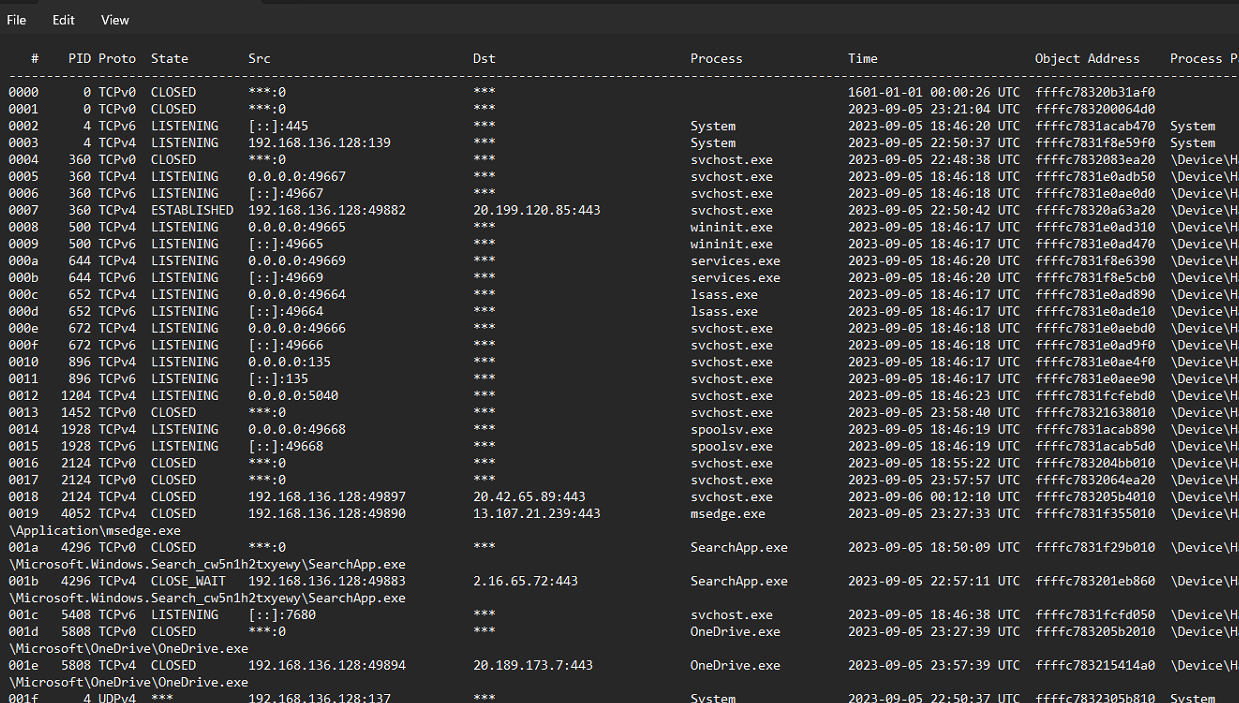
There is an external connection from the suspicious process, which may indicate a C2 connection.
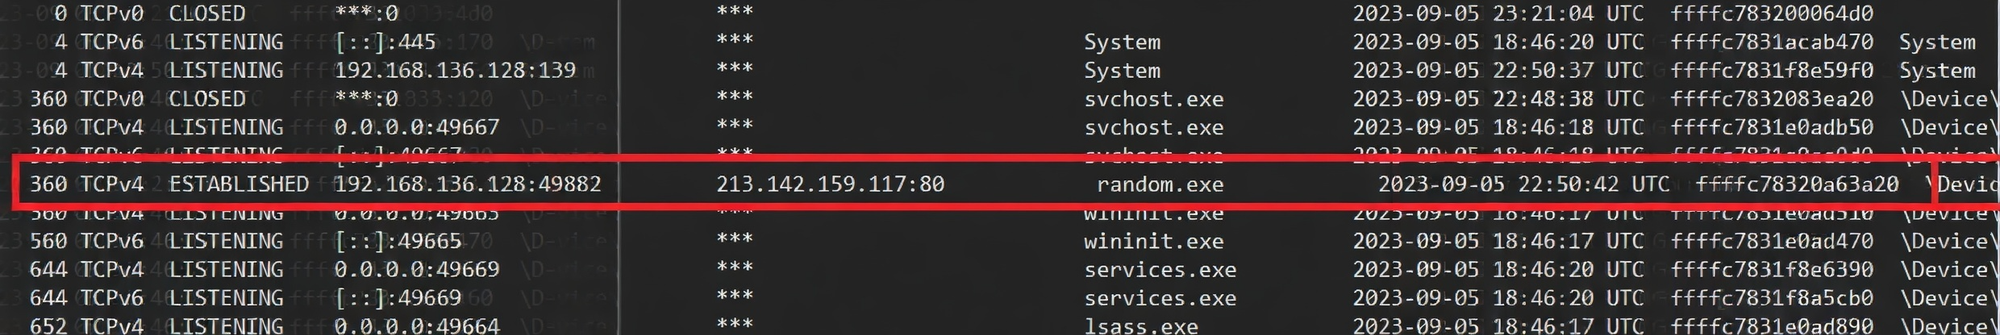
We can investigate the host by performing a Google search or checking its reputation on services like VirusTotal. This may provide us with clues about whether it's benign or malicious.
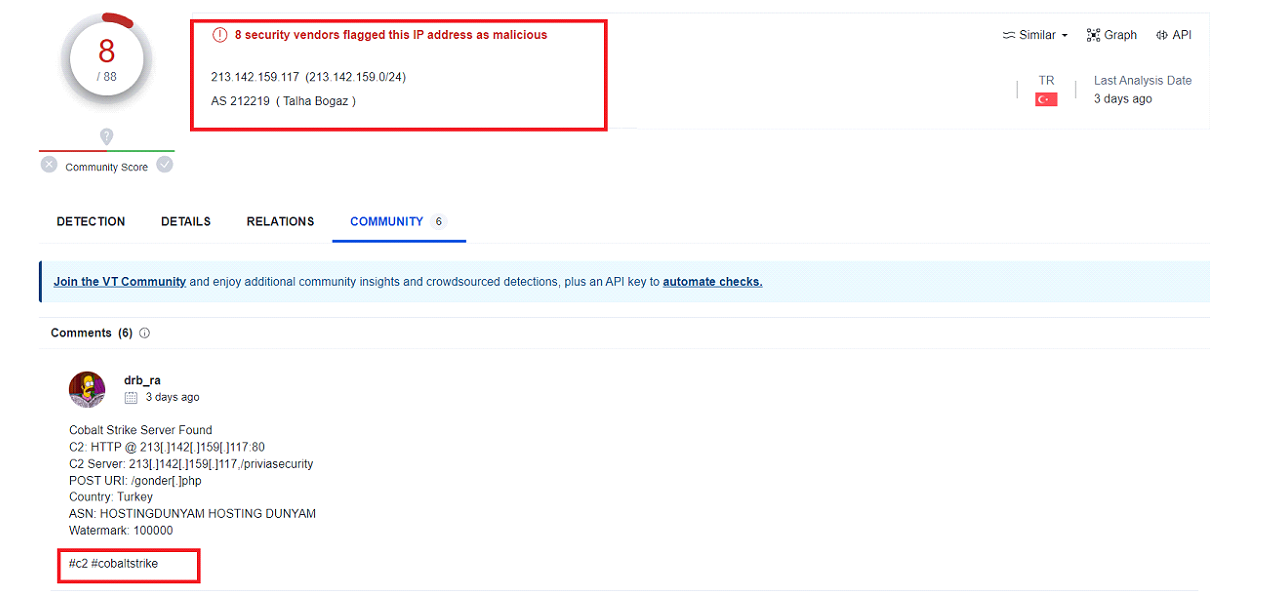
By searching the IP address on VirusTotal , we can see that this IP is already flagged and confirm that it is related to the Cobalt Strike C2. We can also use other search engines like abuseipdb.
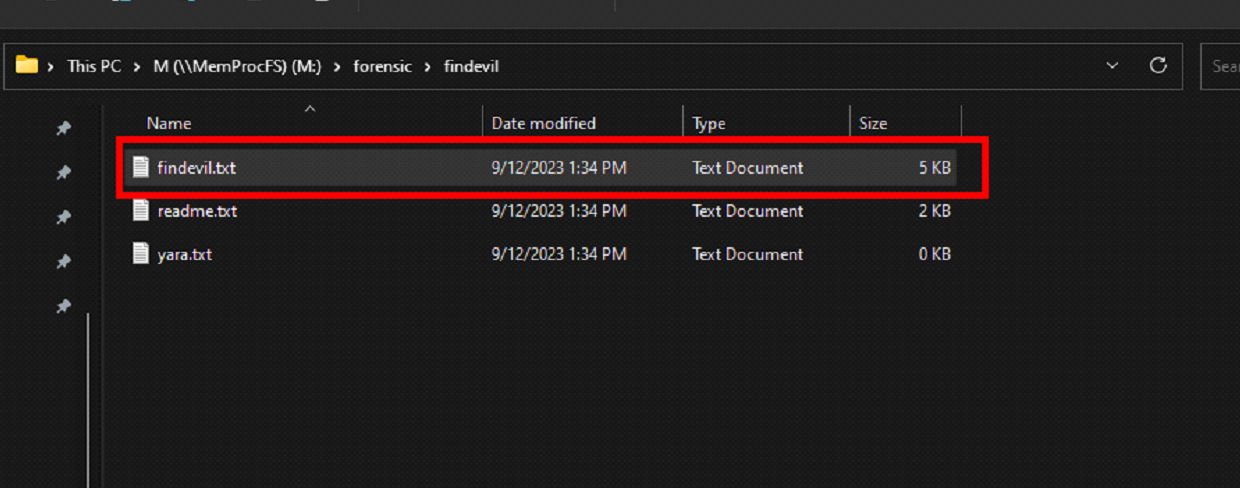
Findevil
FindEvil is a MemProcFS feature for detecting user-mode malware using indicators and built-in YARA rules. While helpful, it may miss newer threats that lack YARA signatures and can produce false positives. These process flags serve as an additional layer of detection.
FindEvil works after launching memprocfs with the forensic option. Also, you might have to wait a few minutes before checking the results.
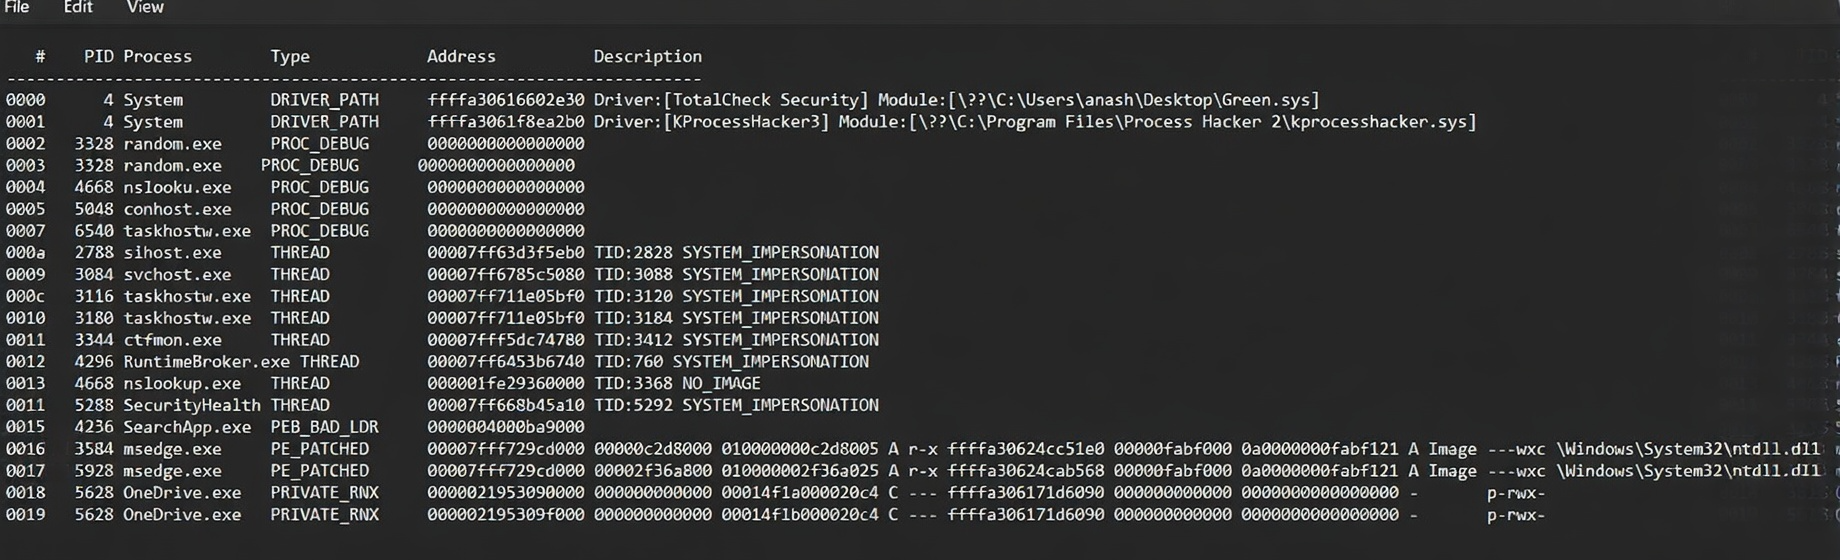
Indicators of Evil
In FindEvil, there are multiple types of modules, and each module is responsible for describing potential threats and their respective results.
Useful for detecting common code injection techniques by identifying behavioral traces, but may produce false positives.
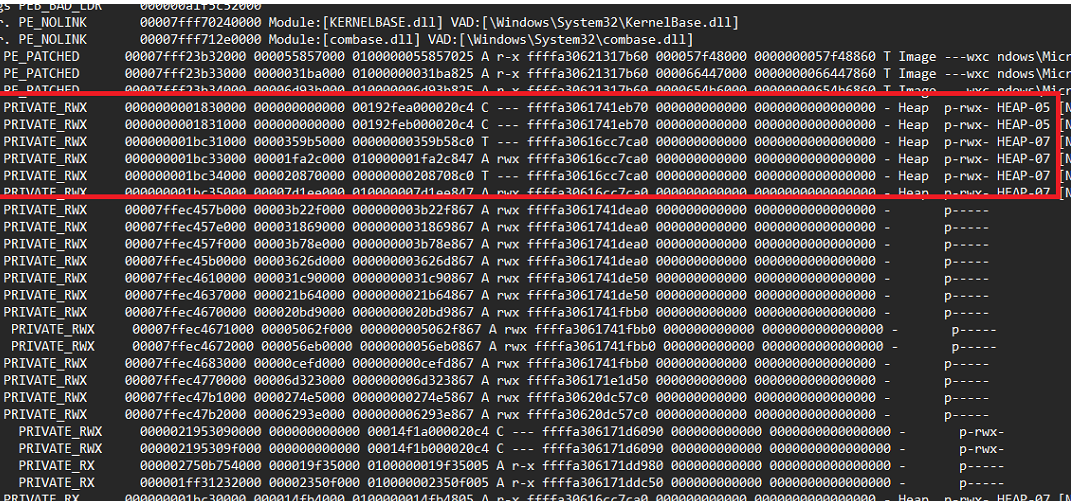
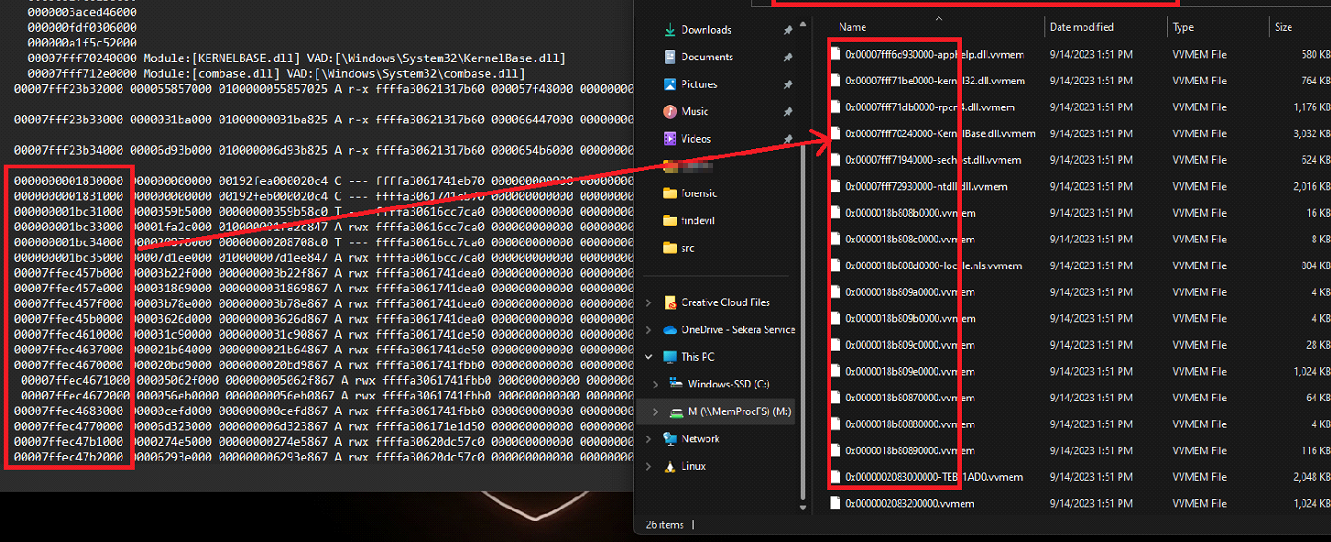
PRIVATE_RWX memory can indicate code injection, but it’s not conclusive, further analysis is required due to possible false positives.
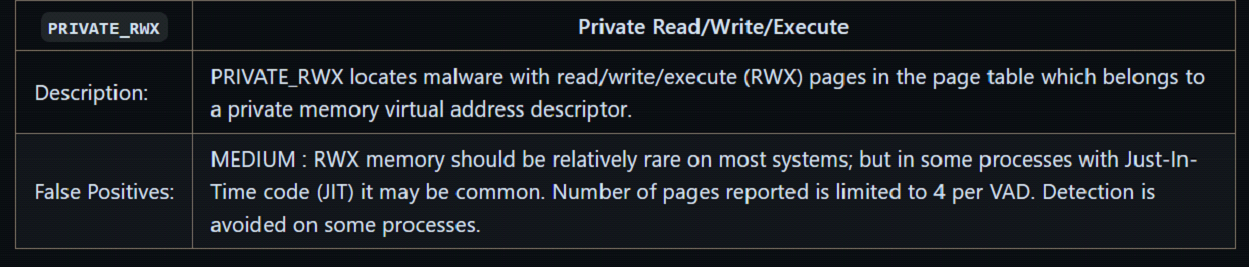
to check the data of these segments, you can navigate to the vmemd folder. From there, you can closely inspect the memory, verifying and eliminating any potential false positives.
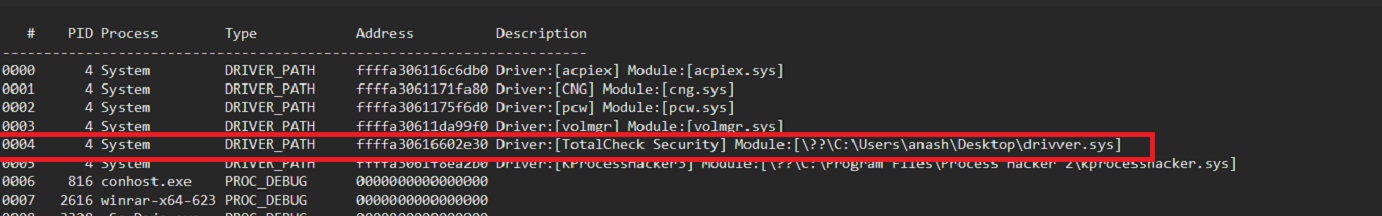
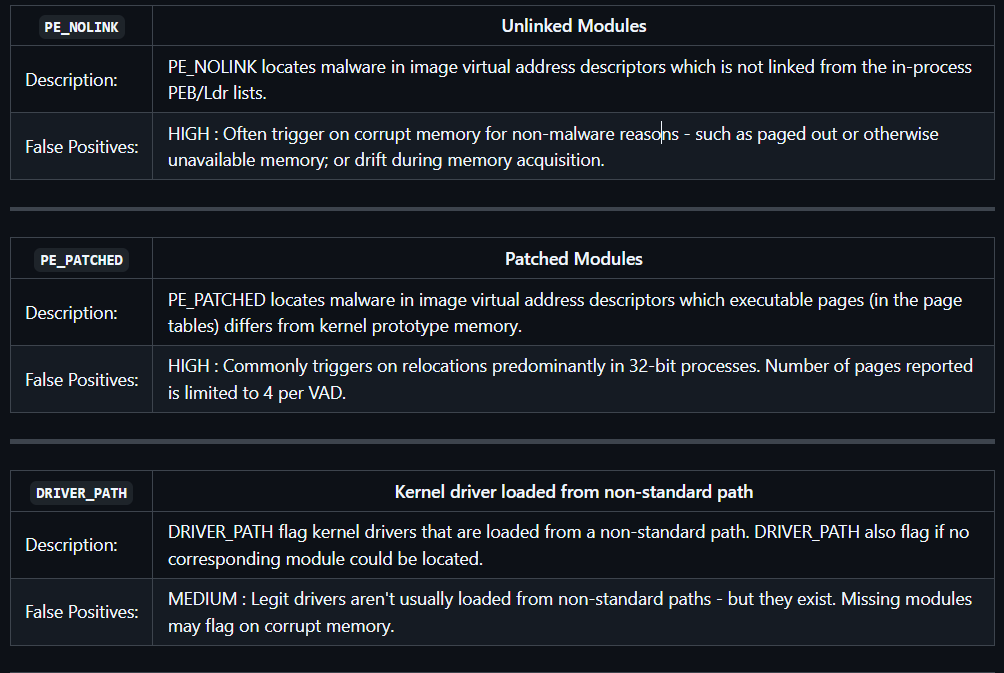
This module flags drivers loaded from non-standard paths or missing modules, helping detect BYOVD attacks, but may produce false positives (e.g., rare legitimate cases or corrupted memory).
Numerous modules are available to assist in identifying potential threats. You can explore and discover these modules on the following resource: https://github.com/ufrisk/MemProcFS/wiki/FS_FindEvil.
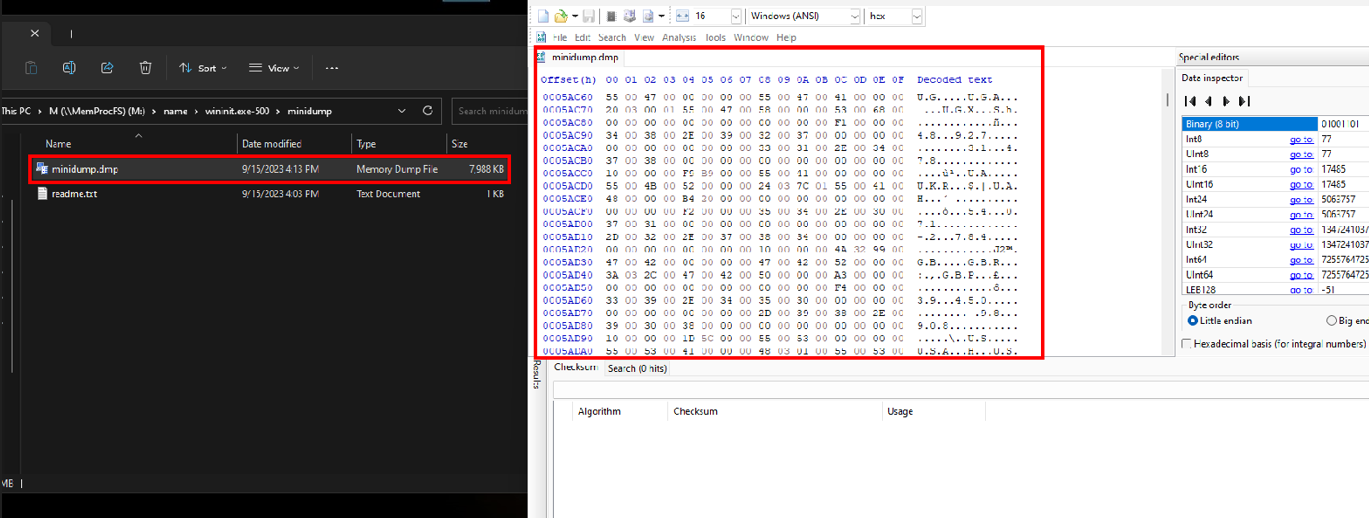
Minidump
Minidumps contain process data with IOCs (IPs, links, etc.) and can be scanned with YARA or regex to quickly identify malicious activity, especially in large files.
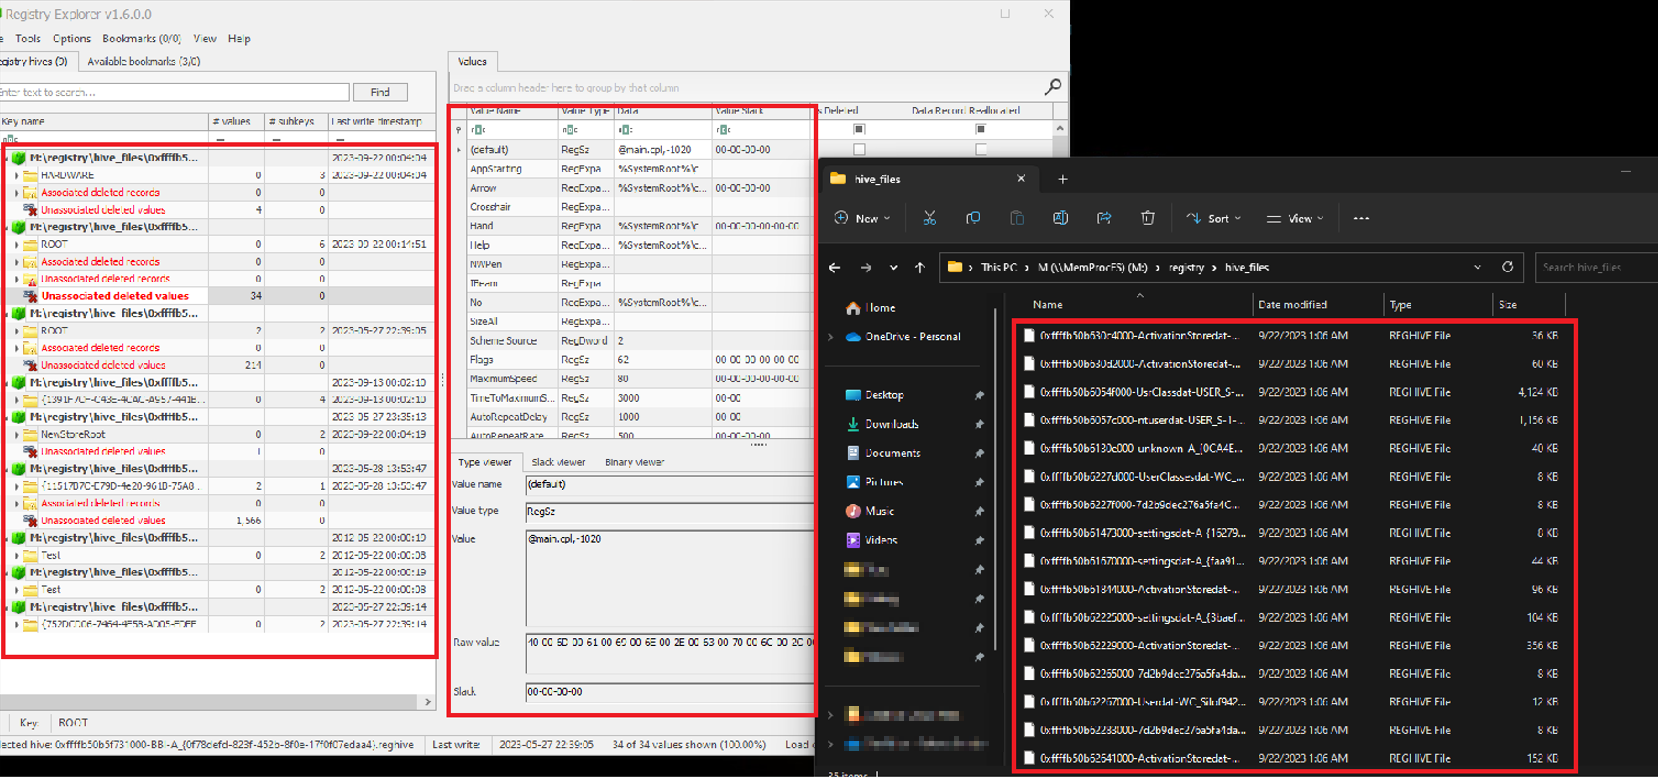
Registry
Windows Registry: is a central database storing system, user, and application configuration data, valuable for forensic analysis.
Registry Hives: Structured sections that organize registry data:
- HKCR: File associations and program mappings
- HKCU: Current user settings
- HKLM: System-wide configuration
- HKU: All user profiles
- HKCC: Current hardware configuration
Hive files are stored in %SystemRoot%\System32\Config.
Malware Usage:
- Persistence: Auto-run via registry keys
- Configuration: Stores C2 info, keys, settings
- Rootkit Behavior: Hides activity via registry changes
- Payload Storage: Stores encoded malicious data
- Evasion: Disables security mechanisms
- System Manipulation: Alters security settings (e.g., UAC, Defender)
- Data Theft: Stores stolen sensitive data
Registry analysis tools (e.g., Eric Zimmerman’s) help inspect and extract this data.
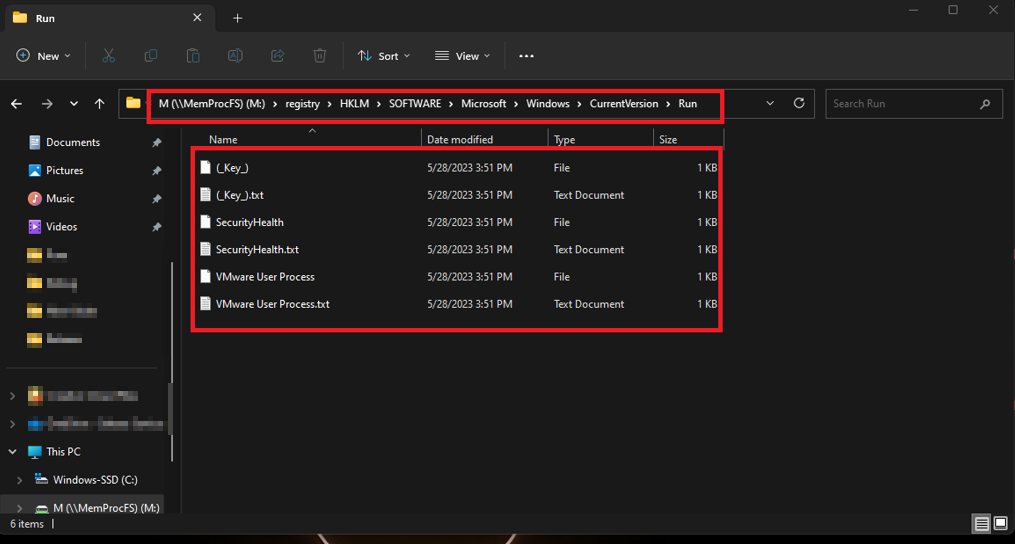
Persistence (Registry): Check common autostart keys for suspicious entries:
HKCU\Software\Microsoft\Windows\CurrentVersion\RunHKCU\Software\Microsoft\Windows\CurrentVersion\RunOnceHKLM\SOFTWARE\Microsoft\Windows\CurrentVersion\RunOnceHKLM\SOFTWARE\Microsoft\Windows\CurrentVersion\Policies\Explorer\RunHKLM\SOFTWARE\Microsoft\Windows\CurrentVersion\Run
Always review these keys manually, even if no obvious results appear, Programs in these registry paths run automatically at user login. Malware often targets them for persistence, so monitoring these keys helps detect and prevent security threats.
Conclusion
MemProcFS simplifies memory forensics by mounting memory as a file system, making analysis faster and more intuitive compared to traditional tools like Volatility.
Resources